Monitoring structural displacements and vibrations is crucial for maintaining the integrity of bridges while ensuring their safety, and one new solution is currently emerging as a key technology in this field. Powered by advanced cameras and cutting-edge algorithms, computer vision (CV) enables non-contact, real-time or post-processing extraction of critical structural parameters. It offers a paradigm shift in bridge structural health monitoring (SHM) with benefits that include rapid deployment, cost-effectiveness, and extended measurement range.

Deflections under live load were measured on a number of bridges, including Manhattan Bridge (Shutterstock/HermBeHobbying)
By accurately identifying and measuring structural changes in real time, CV allows engineers to implement proactive maintenance. Its non-contact nature and ability to provide detailed measurement data address the shortcomings of traditional sensor systems, making it an attractive alternative for structural health monitoring. The accuracy and adaptability of computer vision have led to its widespread use across various fields.
Conventional methods such as linear variable differential transformers and accelerometers, though well established, typically require direct contact with the structure. This can complicate installation, potentially disrupt traffic, and increase costs. And while non-contact methods like GPS and laser vibrometers offer alternatives to traditional techniques, they come with their own limitations.
Even with advanced techniques such as precise-point positioning, GPS can exhibit relatively large inaccuracies in displacement measurements, typically in the decimetre range. It also requires longer convergence times and unobstructed sky views, limiting its applicability primarily to long-span bridges. Laser vibrometers, while providing accurate displacement and acceleration measurements, are constrained by limited measurement distances – usually up to 100m – and function exclusively along the laser beam’s direction. These factors collectively impact the accuracy, measurement range, and versatility of non-contact methods in various monitoring scenarios. These challenges underscore the need for innovative, non-invasive, and cost-effective solutions for bridge monitoring.
Developed by CHI, StructuralVision is novel CV software that allows marker-free structural motion analysis directly from videos – regardless of the recording device – via an intuitive graphical interface. By integrating a range of CV algorithms, the software is adaptable to various bridge monitoring scenarios.
Built on industry-standard computer vision libraries, such as OpenCV, StructuralVision integrates multiple computer vision algorithms, encompassing phase-based, feature-based, and tracker-based methods, catering to a diverse range of applications.
Fundamentally, StructuralVision employs sophisticated image processing and object tracking algorithms to follow the movement of a user-defined region of interest or a targeted object across consecutive video frames. By identifying and comparing the target’s position in each frame, the underlying algorithm calculates the displacement with subpixel accuracy. These pixel displacements are then converted into real-world physical displacements using appropriate scaling and perspective transformation.
The tracker-based methods focus on predicting an object’s location in subsequent video frames, given its initial bounding box. A tracker is initialised on the object in the first frame and updated frame-by-frame based on appearance, motion, or other features. This approach aims for continuous and accurate tracking despite challenges like occlusion or deformation, making it particularly useful for monitoring structural elements under varying conditions.
Also incorporated in the algorithm are phase-based methods, which are highly robust to changes in illumination and thus effective in environments with varying lighting conditions. They offer computational efficiency by using Fast Fourier Transforms, allowing for quick analysis even with large datasets. These methods provide high precision, often achieving subpixel accuracy, which is essential for tracking subtle movements or displacements. Additionally, they are well-suited for detecting global translational motion, making them valuable in SHM applications.
In addition, feature-based methods match or track objects by identifying and describing distinctive points or regions in images and establishing correspondences between them across multiple images or video frames. The process involves feature detection, description, and matching. These methods offer advantages such as robustness to illumination, scale, and viewpoint changes, and can handle partial occlusions and deformations. In structural monitoring, they are particularly useful for tracking complex structural elements or when dealing with challenging environmental conditions.
The selection of the optimal algorithm is contingent upon the specific application and the characteristics of the structure being monitored, and users are empowered to make informed choices based on their unique requirements.
There are now several real-world case studies that demonstrate StructuralVision’s ability to extract structural displacements and modal parameters from video data, showing the software’s potential for non-contact, real-time bridge health monitoring.
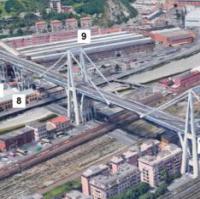
The Manhattan Bridge crosses the East River in New York City, connecting Lower Manhattan at Canal Street with Downtown Brooklyn via three suspension spans measuring 220.5m, 451m, and 220.5m. The bridge deck carries seven vehicular lanes (four on an upper level and three on a lower level), as well as four subway tracks, with two tracks flanking each side of the lower-level roadway. Known for its significant deflections under train loading, despite a torsional strengthening project in early 2000s, the bridge presents an ideal scenario for demonstrating the capabilities of computer vision-based deflection monitoring.
To capture the motion of the superstructure, a camera was strategically positioned on the Manhattan side, approximately 457m from the bridge’s mid-span.
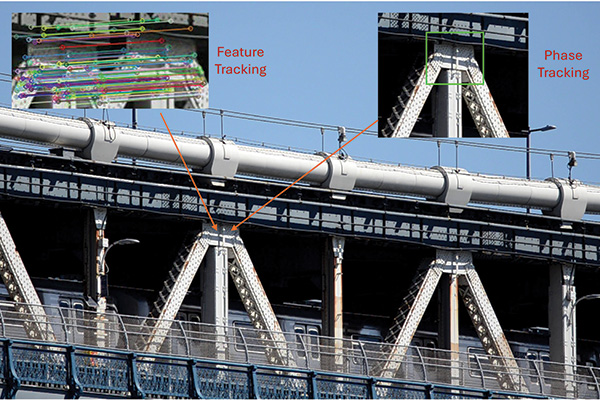
Manhattan Suspension Bridge: targeted area of the superstructure
The region of interest was defined around a gusset plate near the top chord, and two distinct algorithms – phase and feature-based – were selected for comparative analysis. The phase-based method gauges relative movement by analysing shifts in the frequency domain representation between frames, while the feature-based method tracks movement by comparing low-level features in image textures. Both algorithms independently generate displacement time-histories by tracking the movement of the targeted area relative to its initial position, achieving sub-pixel accuracy.
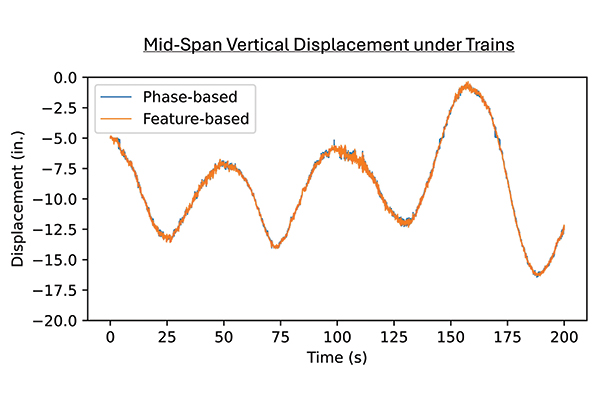
Manhattan Bridge: deflection vs time history of the targeted area
The deflection-versus-time histories obtained from both methods exhibited remarkable consistency despite their fundamentally different algorithmic foundations. The vertical movement of the bridge, primarily induced by subway train crossings, was clearly discernible. Variations in peak deflections corresponded to the timing of trains traveling in opposite directions. The maximum deflection of 40.64cm, coinciding with the near-simultaneous arrival of two trains at mid-span, underscored the range of live-load deflection observed. The study exemplifies the efficacy of CV in capturing subtle structural movements under real-world conditions, even from a considerable distance.
The Benjamin Franklin Bridge crosses the Delaware River and connects Philadelphia, Pennsylvania and Camden, New Jersey with an impressive 533m suspension span and two 229m-long anchor spans. The bridge deck accommodates seven vehicular lanes, with an upper level carrying five lanes and a lower level carrying two. It also provides passage for the PATCO Speedline, a rapid transit system with two tracks running outboard of the lower-level roadway.
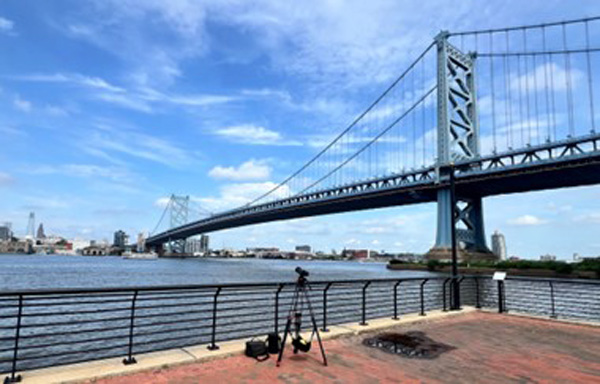
Benjamin Franklin Bridge: camera setup
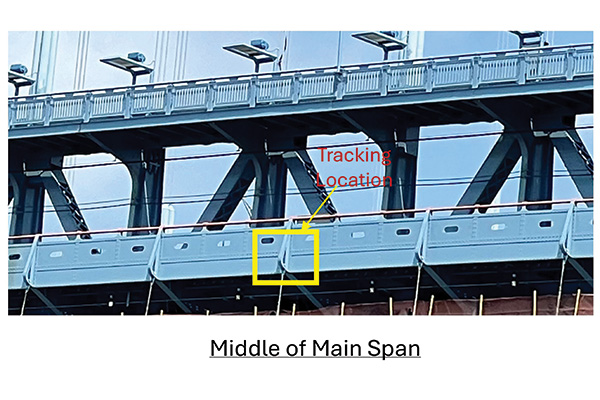
Benjamin Franklin Bridge: the region of interest was defined around a steel bracket near the bottom chord
A camera positioned 535.6m from the bridge’s mid-span on the Camden side captured the motion of the superstructure, with the region of interest defined around a steel bracket near the bottom chord.
The featured-based tracking method was used, and the vertical deflection of the stiffening truss under the passage of one train was measured. In addition, a vibration mode of the main span with a frequency of 0.22Hz was identified.
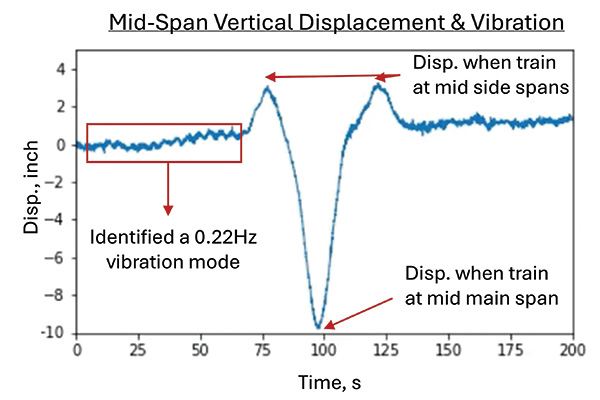
Benjamin Franklin Bridge: mid-span vertical movement under train loading
The third case study involved the Walt Whitman Bridge, a 3,652m-long suspension bridge over Delaware River that connects Philadelphia and Gloucester City, New Jersey with a 610m-long main span. The bridge’s seven lanes, comprising three lanes in each direction and a reversible centre lane managed by a zipper barrier, facilitate efficient traffic flow during varying traffic volumes.
The objective was to assess the vibration frequencies and tension forces in the bridge’s suspenders and cables using the CV method. The second suspender from the Philadelphia tower in the main span row, with a theoretical length of approximately 57.8m, was selected for monitoring. A cell phone camera, positioned at deck level on the tower, recorded the suspender’s vibration.
A tracker-based method was employed for vibration tracking: Unlike approaches that rely on the first frame as a reference, this method predicts the target’s position in subsequent frames based on estimated dynamics, enhancing robustness in scenarios where the target lacks distinct features, exhibits repetitive textures, or demonstrates localised motion.
Following the capture of the displacement time history, a modal analysis was conducted to extract modal characteristics. The identified frequencies for the first and second modes are 1.35Hz and 2.78Hz, respectively. Leveraging the natural frequency, geometric attributes, and material properties of the suspender, the calculated cable tension force is 338kN. This value is within 5% of the as-designed dead-load tension of 320.2kN, derived from the contract drawings.
This non-invasive approach to cable tension estimation, particularly valuable for large-scale structures where direct measurement is impractical without deploying costly equipment and disrupting traffic flow, showcases the potential of computer vision in facilitating efficient and cost-effective structural health assessments.
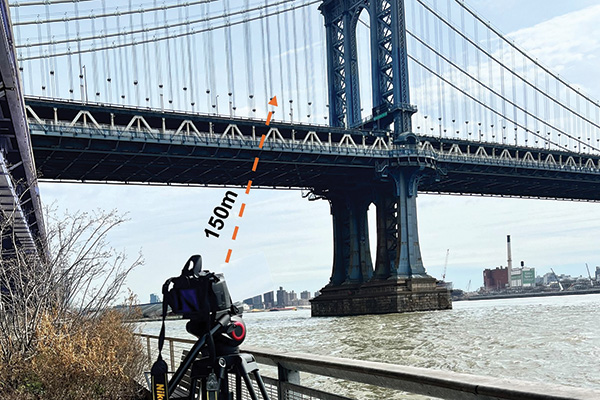
Manhattan Bridge: camera location and distance from the monitored suspenders
The CV approach was also used to measure suspender frequencies in the side span of the previously mentioned Manhattan Bridge from a distance exceeding 150m.
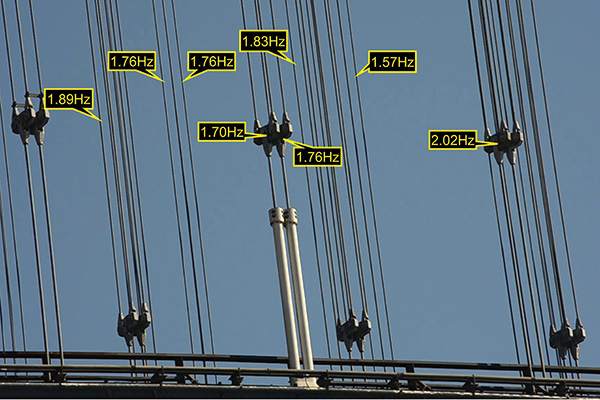
Manhattan Bridge: calculated frequency values overlaid on screenshot of video recording
Crucially, this approach facilitated the simultaneous extraction of modal frequencies from multiple suspender cables within a single video recording. This obviates the necessity for individual cable targeting during data acquisition, significantly expediting the measurement process compared to traditional modal testing techniques which often require sequential measurements of individual cables. This multi-target capability, coupled with the non-contact nature of the CV method, translates to substantial reductions in both operational time and potential traffic disruptions.
The graph shown further below illustrates one of the steps in the CV workflow used to analyse the vibration of a truss member under challenging conditions. Wind-induced vibrations on a US steel truss bridge were captured with an unstable handheld camera many years ago, resulting in low-resolution footage with significant camera motion that obscured the actual structural vibration.
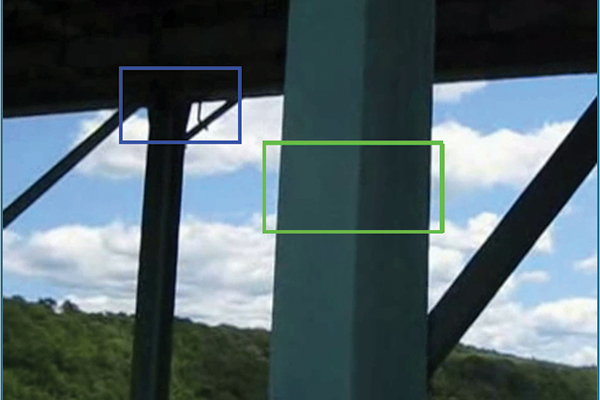
Wind-induced vibrations captured on a steel truss section with an unstable camera
To isolate the true structural vibration, two distinct regions within the video were tracked: one encompassing the vibrating truss member and another representing a relatively stable reference point. By comparing their power spectra, the frequency components associated with camera motion were differentiated from the actual member vibrations. This separation enabled the reconstruction of the vibration signal in both the frequency and time domains, revealing a vibration frequency of approximately 6.86Hz and an amplitude of around 19mm.
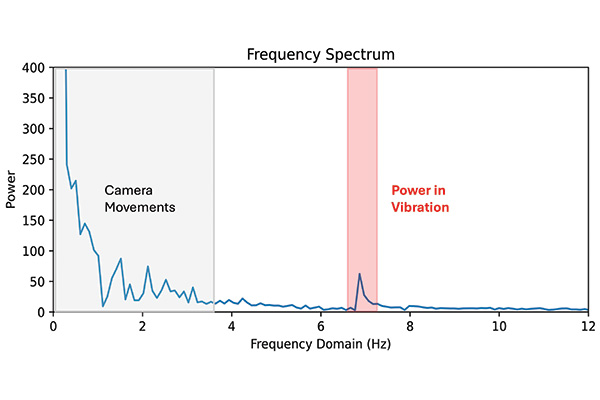
Separating vibration from camera movement using unstable footage
This case study demonstrates the software’s robustness in handling challenging field conditions, particularly low-resolution video and significant camera motion, highlighting its potential for effective SHM in real-world scenarios. The ability to extract accurate vibration data even from suboptimal footage underscores the software’s adaptability to complex field applications.
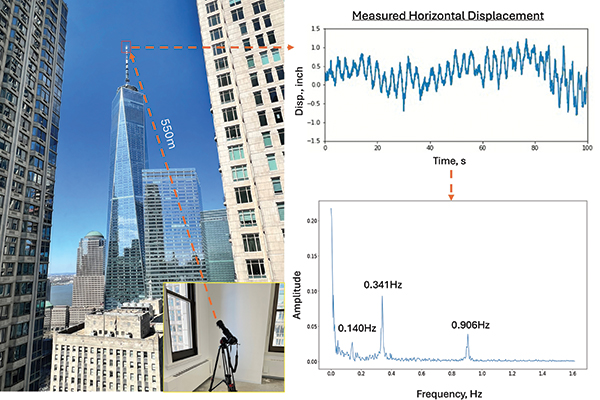
Measuring displacement and vibration of Freedom Tower Spire
The Freedom Tower (One World Trade Centre) in New York City stands at a height of 416.8m with a spire rising 124.4m atop the structure. During a relatively windy day, the movements at the tip of the spire were recorded from about 548.6m away, inside CHI’s office building. Afterwards, the recorded data was analysed using the feature-based and the tracker-based method. Small yet very clear displacement signals were observed, with a magnitude of about ±2.5cm.
After conducting a modal analysis, three frequencies, 0.140Hz, 0.341Hz and 0.906Hz were identified. Based on the estimates by ASCE-7 code, the first mode of the Freedom Tower building is about 0.148Hz, which closely aligns with the measured value of 0.140Hz. The other two modes are believed to be the first and second modes of the spire itself, based on preliminary finite element analysis.
The case studies presented underscore the transformative potential of computer vision in bridge engineering. The successful monitoring of deflections, cable frequencies, and vibrations under diverse conditions highlights the adaptability and robustness of CV-based approaches. The non-contact nature of these methods, coupled with their ability to provide real-time or post-processing analysis, offers significant advantages over traditional sensor-based techniques.
The ability to conduct long-distance measurements, as demonstrated in the Manhattan Bridge case studies, eliminates the need for extensive sensor installations and minimises disruptions to traffic flow. This translates to substantial cost savings and improved efficiency in bridge monitoring. Furthermore, the capacity for simultaneous multi-point measurements, showcased in the cable frequency analysis, streamlines data acquisition and reduces the time and effort required for comprehensive structural assessments.
The resilience of CV in handling challenging scenarios, such as the analysis of unstable camera footage, further underscores its potential for real-world applications. The ability to extract meaningful information from imperfect data expands the scope of CV-based monitoring to include scenarios where traditional methods might falter.
However, it is crucial to acknowledge the limitations of CV. The accuracy of measurements can be influenced by factors such as image quality, lighting conditions, and camera stability during winds. Robust algorithms and careful calibration are essential to mitigate these potential sources of error. Additionally, while CV excels in displacement and frequency measurements, it might not directly capture other critical parameters like strain or material properties. Integration with complementary sensing technologies could address this limitation.
The advancements in CV, coupled with its inherent advantages, position it as a powerful tool for bridge engineers. The non-contact, cost-effective, and multi-point measurement capabilities of CV have the potential to revolutionise SHM and maintenance practices. By enabling real-time assessment of structural behaviour, CV empowers engineers to make informed decisions, implement proactive maintenance strategies, and ensure the long-term safety and serviceability of bridges.
Liwei Han is senior associate, AbdulSame Fazli senior project engineer and Qi Ye managing principal at CHI Consulting Engineers.