I have not yet been able to write on this blog this year, not because of the lack of topics, but because of all the many things that continuously kept me and Bridges to Prosperity busy and focused on enabling trail bridges to provide year-round safe access in East Africa.
More than 250 corporate volunteers hosted, over 60 bridges built, the 200th bridge built in Rwanda (and the 500th built globally), the launch of the AI-powered remote assessment tool FikaMap and the development of a carbon footprint calculator for our bridges – all happened in 2023. What a year for B2P, with so many steps forward! Let me talk you through some of the highlights of this incredible year.
Corporate programme updates
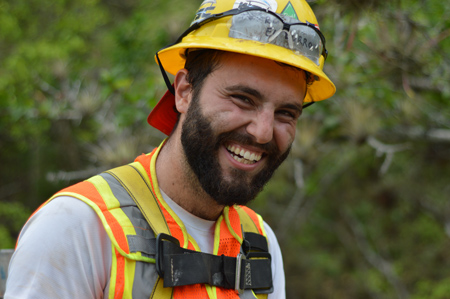
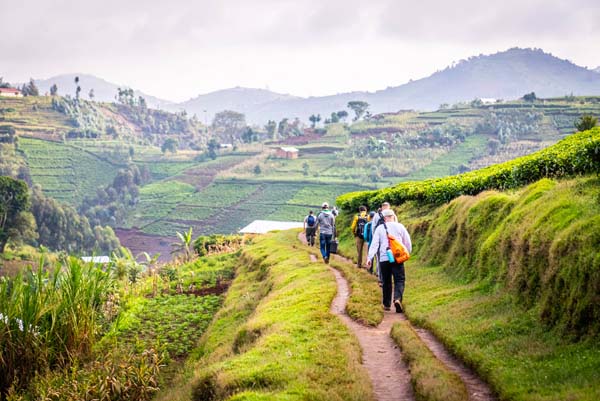
In 2023, over 250 volunteers from more than 30 corporate partners worldwide chose to travel to Rwanda and build a bridge with us, returning to their realities with a different understanding of the connective power of trail bridges. At this rate, every four years we will see 1,000 engineers, constructors and leaders returning to the international AEC industry with a new set of eyes for the infrastructure projects they are working on and the impact that they have on the served population.
Take a look at what volunteering with us looks like, and if this excites you, let’s plan together for you to be a part of the next round of 250 volunteers.
B2P - Join the Corporate Program - FY24 (subtitled) from Bridges to Prosperity on Vimeo.
500th bridge globally
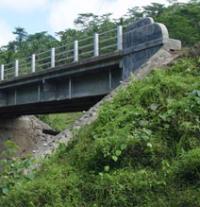
The inauguration of the Rusumo Bridge was full of happiness and joy like all the inaugurations we witness every month, but this was different. Its 59m-long span connected people over a dangerous river. Over 4,000 people now have safe access thanks to this bridge, joining 1,800,000 (almost two million!) people that have been connected by Bridges to Prosperity in the last two decades.
This achievement, our 500th bridge, marks both a fantastic milestone for the organisation but also a reminder for us that if we want to tackle the problem of poverty caused by rural isolation globally within our lifetime, we need to up the pace and build another 500,000 bridges needed to connect all the millions of people that still lack year-round safe access.
Bridges to Prosperity is currently trying to grow to achieve that goal in three main ways:
- Gather the evidence supporting the efficacy and efficiency of safe access as a fulcrum for rural development
- Create collective action (advocacy) to elevate rural transport on the development agenda
- Support governments with technical assistance, best practices, and the capacity to make smart infrastructure investments
These are exciting times for trail bridges, and the momentum is building up to bring us to succeed in it.
Remote partners engagement
Arup and Autodesk are our longstanding corporate partners, and in recent years, they have reverted the focus of their partnership to remote support. Between 2022 and 2023, their volunteers worked with the B2P team toward the development of fantastic tech tools now serving our operations:
• Autodesk: Fika Map (https://map.fikamap.com/). The collaboration with Autodesk has resulted in a suite of remote analysis tools that assesses transportation barriers to critical destinations in rural low-income communities to locate where bridges are needed. Collectively called Fika Map (fika means ‘arrive’ in Swahili), this tool suite will identify the scope and distribution of transportation barriers through entire regions or nations using publicly available data and machine-learning technology.
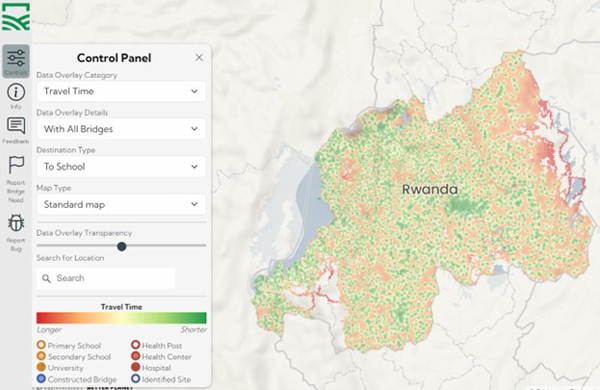
Once barriers are identified, the cost and social impact of addressing them are estimated. The currently available version (V1) was released last November and is available only for Rwanda. Further developments of the Fika Map will allow us to remotely assess the need for trail bridges for entire countries (maybe I will write about that next year).
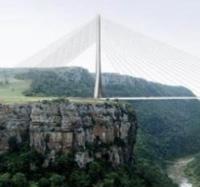
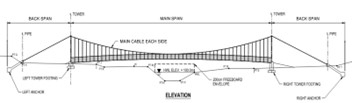
• Arup: Bridge Visualization Tool (b2p.europedigital.arup.com/). This is an excellent and straightforward app that can be downloaded on Android and IO cell phones. It permits the user to explore 3D models of the three types of bridges we build (Suspended, Suspension and Hybrid design – click to see my old blog post to know more about them) including the details of the necessary construction steps. Our staff use this tool to show stakeholders – be it rural farmers, government representatives or funders – how our bridges look. Using photos and blueprint drawings, it provides an instant understanding of how construction sites will look as well.
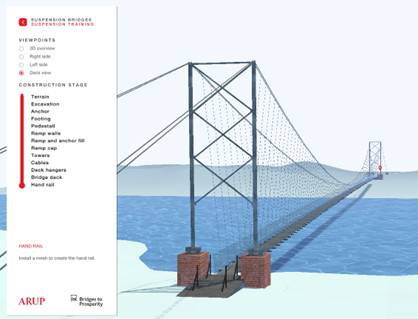
Bridge Visualization Tool
• Arup: Carbon Footprint Calculator (for trail bridges). This Excel-based tool is allowing our procurement department to calculate our bridges' carbon footprint automatically while developing the bill of quantity based on the design drawings. At a time when we plan to enable the construction of thousands of bridges all over the world in the coming decades, it is essential to build a good foundation for the sustainability of our work, and this tool plays and will play a significant role in it. Keep reading to find out more.
Trail Bridge Carbon Footprint Calculator
This time, I would like to focus and give some more details about the Carbon Footprint Calculator. This work provides a much-needed starting point to increase B2P’s broader impact, with initial considerations on how to reduce the embodied carbon of B2P’s bridges even further while demonstrating to B2P’s partners evidence on how rural infrastructure could be both more economical and more sustainable than other types of infrastructure interventions.
Regarding the life cycle stages in the figure above, the scope of the work behind the calculations of B2P bridges’ embodied carbon emissions included A1-5 emissions. It does not include module B (in use and maintenance), C (end of life), or D (broad impacts beyond the system boundary). The material carbon factors form the A1-3 emissions - including A1 (raw materials supply), A2 (transport to manufacturing), and A3 (the manufacturing itself). A4 covers transport from the gate (where the component production is complete) to the construction site, and A5 emissions are those associated with construction.
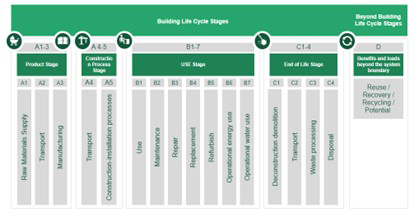
This initial work does not include module B, C or D because they require further insight into the replacement rate of components as well as a more comprehensive understanding of how material extraction impacts the surrounding area.
To determine the carbon factors for the materials, a hierarchical approach has been adopted following the hierarchy below, from the most accurate to the least accurate:
- Supplier Specific Factor –Environmental Product Declaration (EPD) from the supplier or producer, giving kgCO2e per unit of the product when available
- Location Specific Factor – provided by institutions or governments
- Tailored Factor - using the carbon factor from a different country or region and tailoring this to reflect the country required.
- World Factor - using a carbon factor that is an average of factors that can be found worldwide.
It has been an interesting exercise to research carbon factors for materials in Rwanda, which was chosen as a case study due to how active B2P is in the country.
It became quickly apparent that EDPs provided by material manufacturers are scarce in Rwanda and the broader East Africa region. Therefore, understanding the level of information available and contacting suppliers directly was important. Without easy access to EPDs for all materials, a lot of the work was investigative, tracing back the steps of the journey taken by each material to reach the supplier in Rwanda. In the end, all that data has been incorporated into the carbon factors used in the calculator.
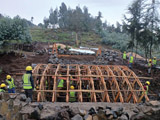
Once the calculator was ready, we had to decide how to use it first. Luckily for us, last year was pretty busy in Rwanda with construction of over 60 bridges. This permitted us, together with the Arup team, to study many different bridges built in the same year, in the exact location, and with the same supply chain, allowing the results to be compared with each other. The main results are:
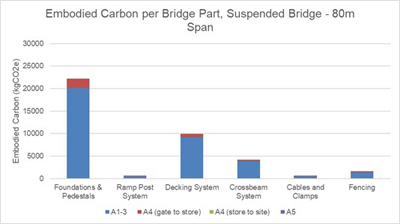
- For the suspended bridge type, an average of 60% of the embodied carbon comes from the abutments and the substructure;
- For the suspension bridge type, an average of 60% of the embodied carbon comes from the superstructure material;
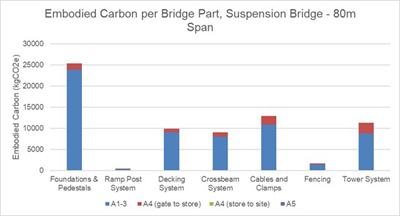
- For the same span, a suspension bridge generally presents a higher quantity of embodied carbon compared to a suspended bridge of the same span.
These interesting results enable us to make precise design decisions that reduce the environmental impact of specific bridge designs.
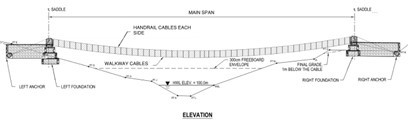
Another remarkable finding came when we pulled together all the data from the studied bridges into one chart to examine the relationship between carbon footprint and the functional area of the bridge, following PAS 2080 [1]. This, the leading international guidance for carbon management in infrastructure, recommends that an available unit is used when assessing the embodied carbon of an infrastructure asset. In the case of our bridges, the functional area is defined as span times functional bridge width.
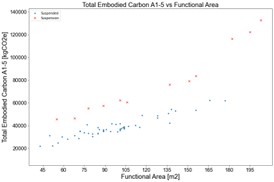
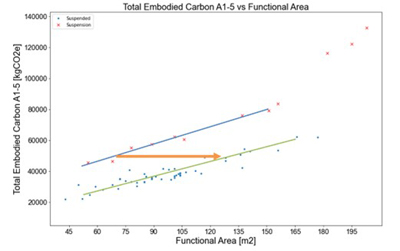
The data showed that the embodied carbon of a suspension bridge is always greater than that of a suspended bridge for a given functional area. As the active area and the span increase, the total embodied carbon for both suspended and suspension bridges increases, becoming non-linear when hitting the longest spans, as lateral stabilisation cables (wind-guy cables) increase by a lot the quantities of materials used coming in with their additional foundations.
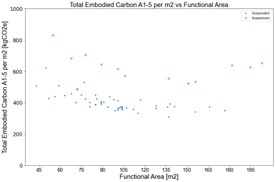
For both bridge types, the embodied carbon efficiency peaks at 120m2 of functional area (around 100m span). For longer spans, it looks like the efficiency stays more or less constant, until hitting the longest-span bridges with lateral wind stabilisation systems (only a few suspension bridges in this case).
With these precise results, we now know that longer spans efficiently reduce the embodied carbon per square meter, and that choosing a longer suspended design over a shorter suspension design will generally lead to a lower carbon footprint for the structure.
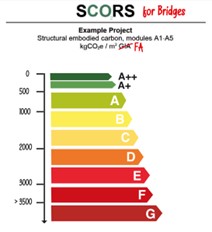
Moreover, using a version of the IStructE’s Structural Carbon Rating Scheme (‘SCORS’), which was adapted from buildings [2] to bridges [3], B2P can now communicate the carbon performance of a bridge project. The rating system is shown below, and it is important to remember that this SCORS rating system is solely based on the A1-5 embodied carbon per functional area of a bridge.
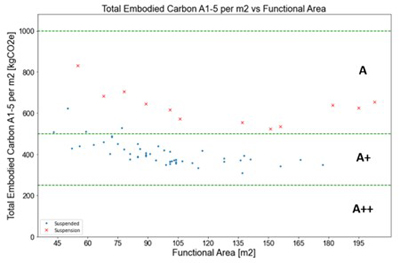
We can see how the B2P bridges sit in the A and A+ rating categories. All suspension bridges sit in the A category and most suspended bridges are A+, while only a few with shorter spans sit in the A category.
This is already giving B2P an initial way to promote discussions regarding the comparison with other infrastructures built in Rwanda in terms of embodied carbon. As the organization grows, being able to transmit the importance of considering the carbon impact when planning infrastructure can influence policies beyond rural infrastructures and trailbridges.
What more to say? It has been an exciting and inspiring year for B2P, where many different solid foundations have been laid for building future bridges to better lives in rural communities. I look forward to updating you on where our work will take us next year!
Talk to you soon,
Nico
PS If you would like to learn more about Bridges to Prosperity and follow our work in East Africa and beyond, here are some useful links:
Website: www.bridgestoprosperity.org
Facebook: https://www.facebook.com/BridgestoProsperity
Instagram: https://www.instagram.com/bridgestoprosperity/
Twitter: https://twitter.com/B2P
LinkedIn: https://www.linkedin.com/company/bridges-to-prosperity/
Vimeo: https://vimeo.com/bridgestoprosperity
And if you would like more details on how you and your company can join us in East Africa and participate directly in the construction of a trail bridge, please visit: https://www.bridgestoprosperity.org/corporate/ or contact me directly on nicolaturrini@bridgestoprosperity.org.
References:
[1] British Standards Institution (2016) PAS 2080:2016 Carbon management in infrastructure, London: BSI
[2] Arnold W., Cook M., Cox D., Gibbons O. and Orr J. (2020) ‘Setting carbon targets: an introduction to the proposed SCORS rating scheme,’ The Structural Engineer, 98 (10), pp. 8–12
[3] Archer-Jones C., Green D. (2021) ‘Carbon targets for bridges: a proposed SCORS-style rating scheme’, The Structural Engineer, 99 (10), pp. 14-18